We’ve heard from our users that utility fees can be complex and difficult to understand. Utility bills may have dozens of components and may not break down the source of fees, making costs very difficult to predict without the right reporting tools.
That's why we've revamped utility reporting in Flipturn's energy management to make charging costs easier to understand and more actionable. By applying your utility provider's rates to your charging session data, Flipturn estimates costs, identifies the source of each fee, and surfaces optimization opportunities.

Understand maximum power demand charges
Utilities often charge you by the maximum amount of power used at any single time over the course of a month. This means that if your power usage spikes to 500kW just one time, you’ll still get charged a fee for that one-off 500 kW peak. These extra fees can be in the thousands of dollars, depending on the utility rate. For the math on why peak power can cost more than energy itself, see our worked example on lowering peak power demand.
On your power bill, these fees are called “demand charges” and “facilities charges.” Predicting demand charges is difficult, especially since maximum power is often read by the meter over a period of 15 minutes, and some demand charges can look back over a period longer than a month.
Flipturn calculates demand charges under the hood, automatically surfacing the time window and day the maximum amount of power was used and estimating the resulting demand charges. View the maximum power across each day to understand whether this spike was an anomaly for that day, or a normal occurrence.
Analyze daily site power demand
Once you identify a day with high power usage, you can dive into the power used over the course of that day, visualizing how each charging session contributed to this cost curve. This single day view can help you understand how peak shaving or shifting charging to off-peak times can help decrease charging costs.

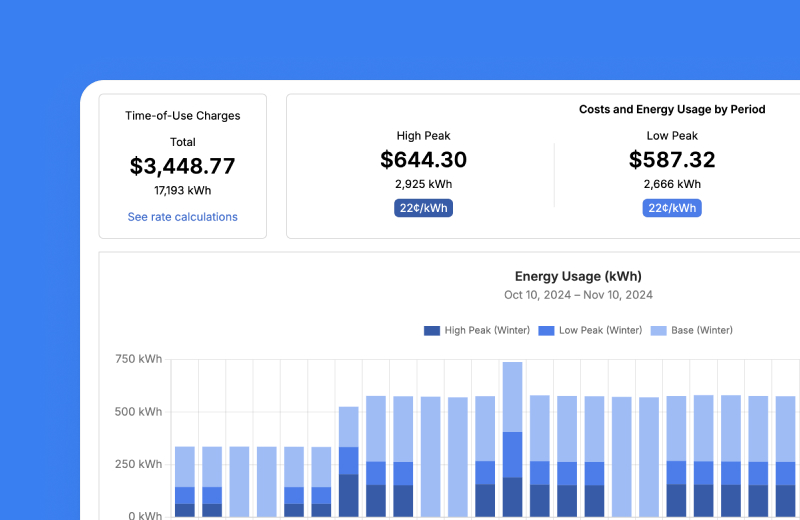
Understand energy usage across different Time of Use periods
Utilities charge more for energy used during certain hours, such as 4-9pm in Southern California. Flipturn shows how much you’re paying for electricity across each Time of Use rate, as well as how much energy was used in each time period. Our usage analytics lets you spot days in which your organization charged suboptimally and incurred higher per-kilowatt hour energy fees.
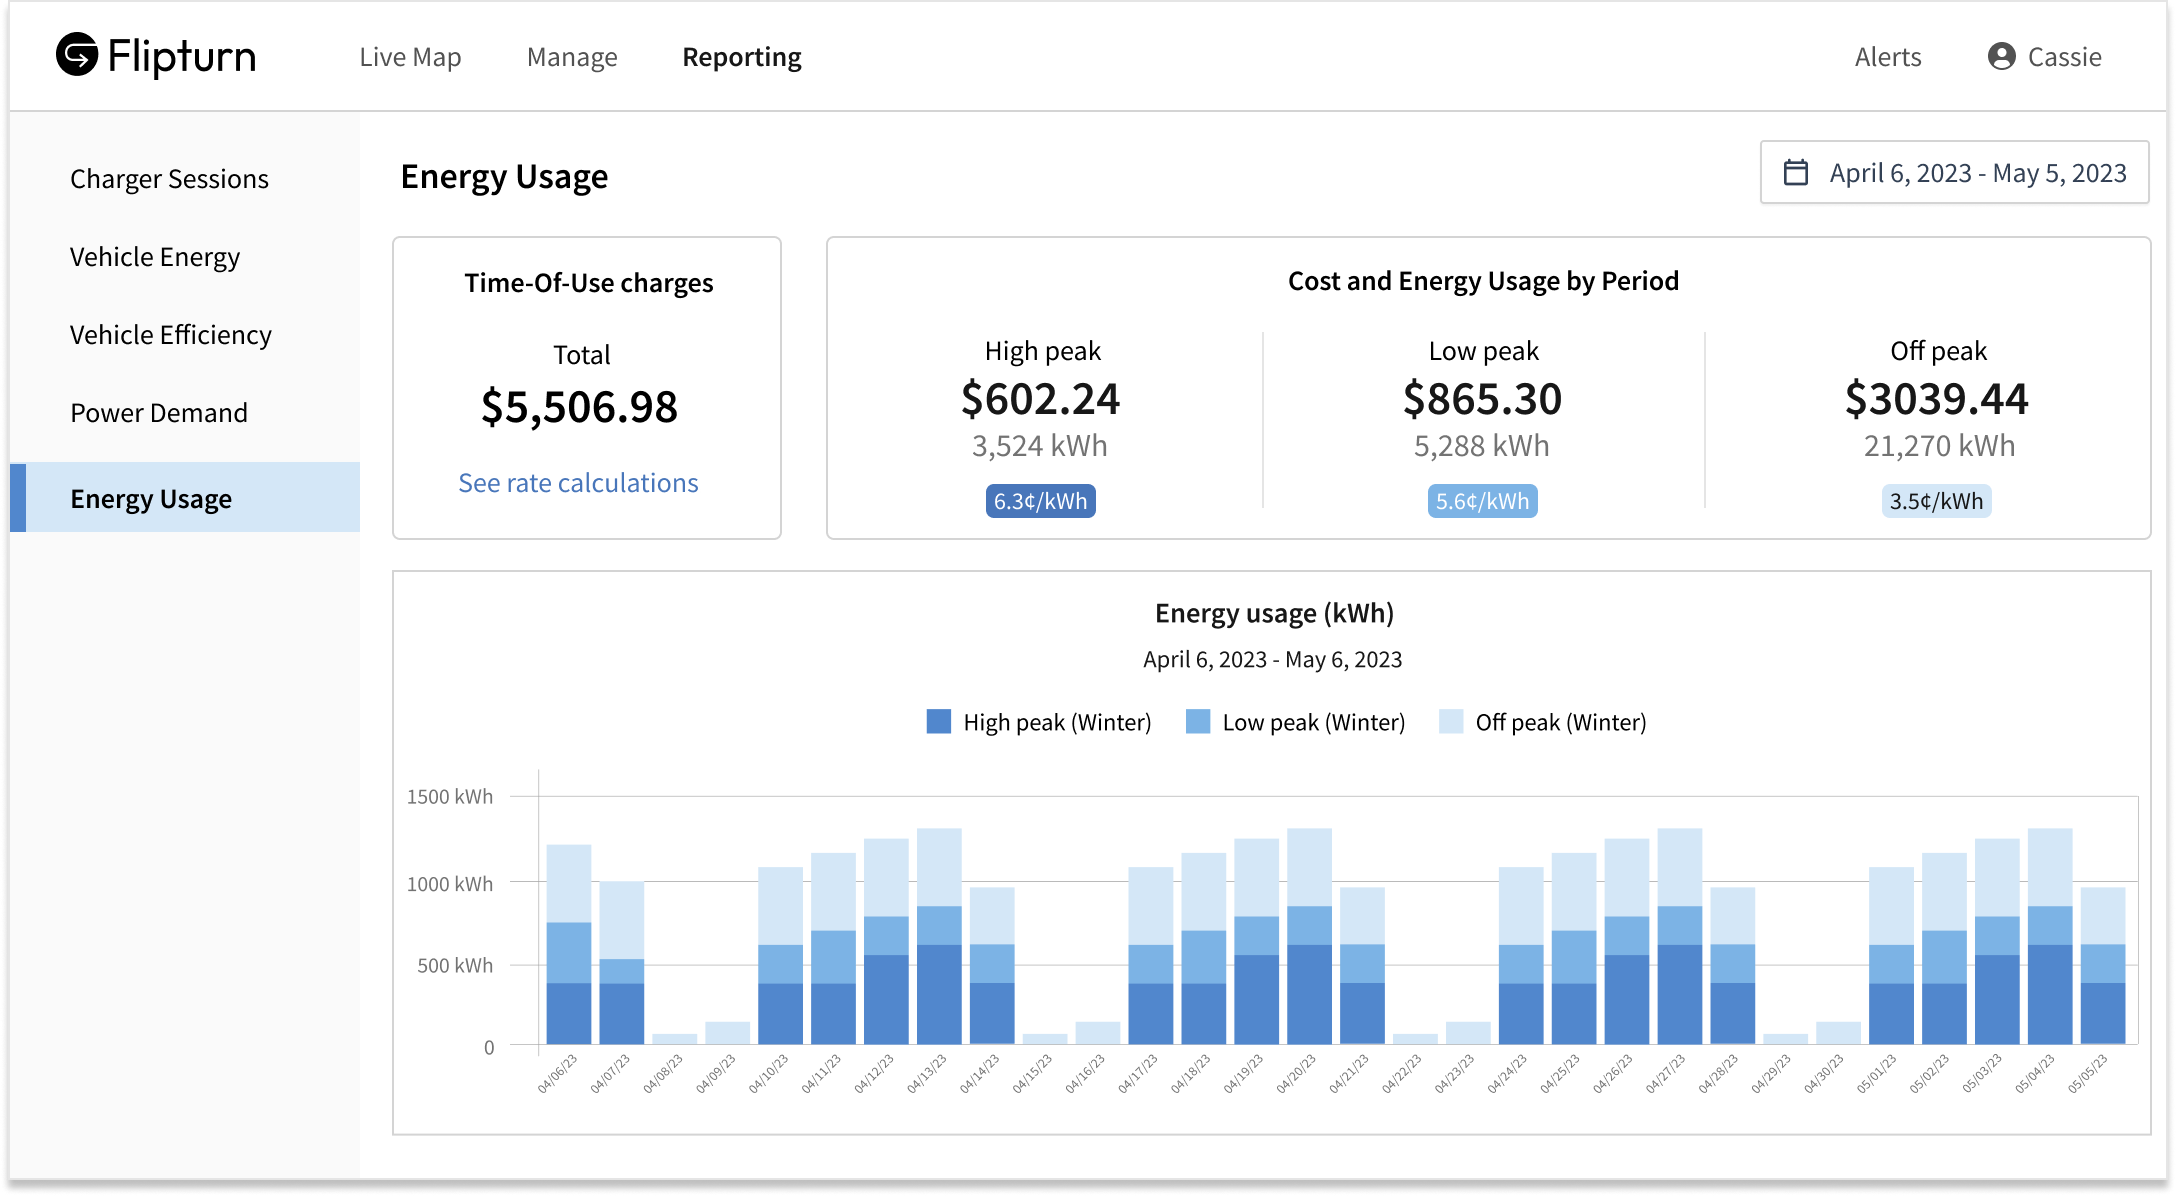
Cost per charging session estimates
Using detailed charging session data and your utility rates, Flipturn estimates the energy cost of each charging session, even when one session spans multiple time-of-use rate windows.

Understanding charging costs is the first step; acting on them is the next. Flipturn's energy management applies site-level power limits and dynamic load balancing to shift charging to off-peak times while still hitting vehicle readiness targets. Customers using this combination have cut demand-charge line items substantially — Titan Freight dropped its effective electricity cost from $0.40/kWh to about $0.18/kWh (see their story), and Purolator reported a 60% reduction in peak demand charging costs (see their story).
Book a demo, or browse how fleets use Flipturn in production.