Many of the fleet managers we work with at Flipturn use cost per mile as a key performance metric. As you add EVs to your fleet, comparing the cost per mile of operating your EVs with that of your internal combustion engine (ICE) vehicles can help you understand whether you’re getting the expected ROI on your EV investment.
Since electric vehicles are powered by batteries instead of diesel or gasoline, vehicle efficiency is measured in miles per kilowatt-hour (kWh), rather than miles per gallon. So, to get the fuel cost per mile of an EV, we’ll want to calculate:

Below: three factors that affect cost per kWh and kWh per mile, and how Flipturn for fleets helps you identify the best opportunities to drive down each one.
Vehicle efficiency (kWh per mile)
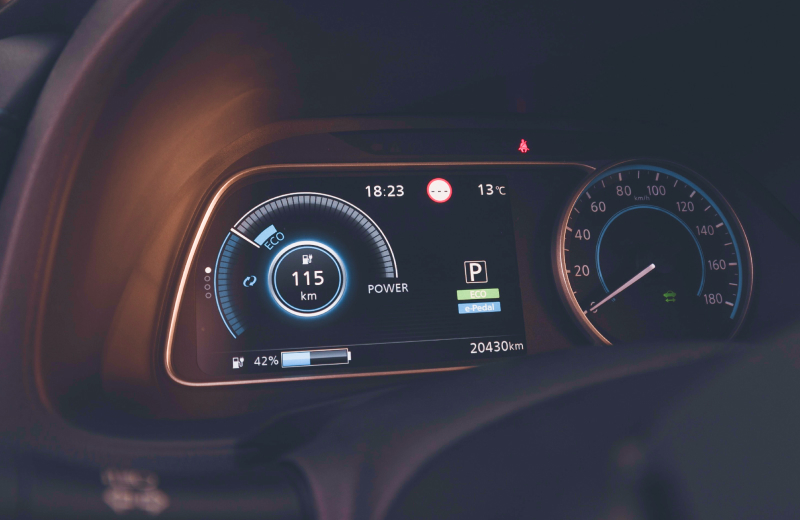
Existing telematics systems often report the energy expended by EVs while driving. EVs also offer regenerative braking: when a driver lifts off the accelerator, the EV slows, feeding the recovered energy back into the battery.
Calculating kWh per mile accurately requires factoring in regenerative braking and using net energy, otherwise cost per mile gets over-reported. Flipturn uses both energy out and energy fed back into the EV. Fleet charging management surfaces regenerative braking and efficiency data per vehicle and per driver, so fleet managers can spot where driver behavior is leaving range on the table and coach against the data, not against feel.

Time of Use rates (energy cost per kWh)
Time-of-use (ToU) fees are charged on total energy delivered to your site, with rates that vary by time of day. Charging between 4pm and 9pm, a common peak window, can be almost double the cost per kWh of charging during off-peak hours like 9pm to 10am. We've covered how to save money charging your EV fleet more broadly elsewhere.
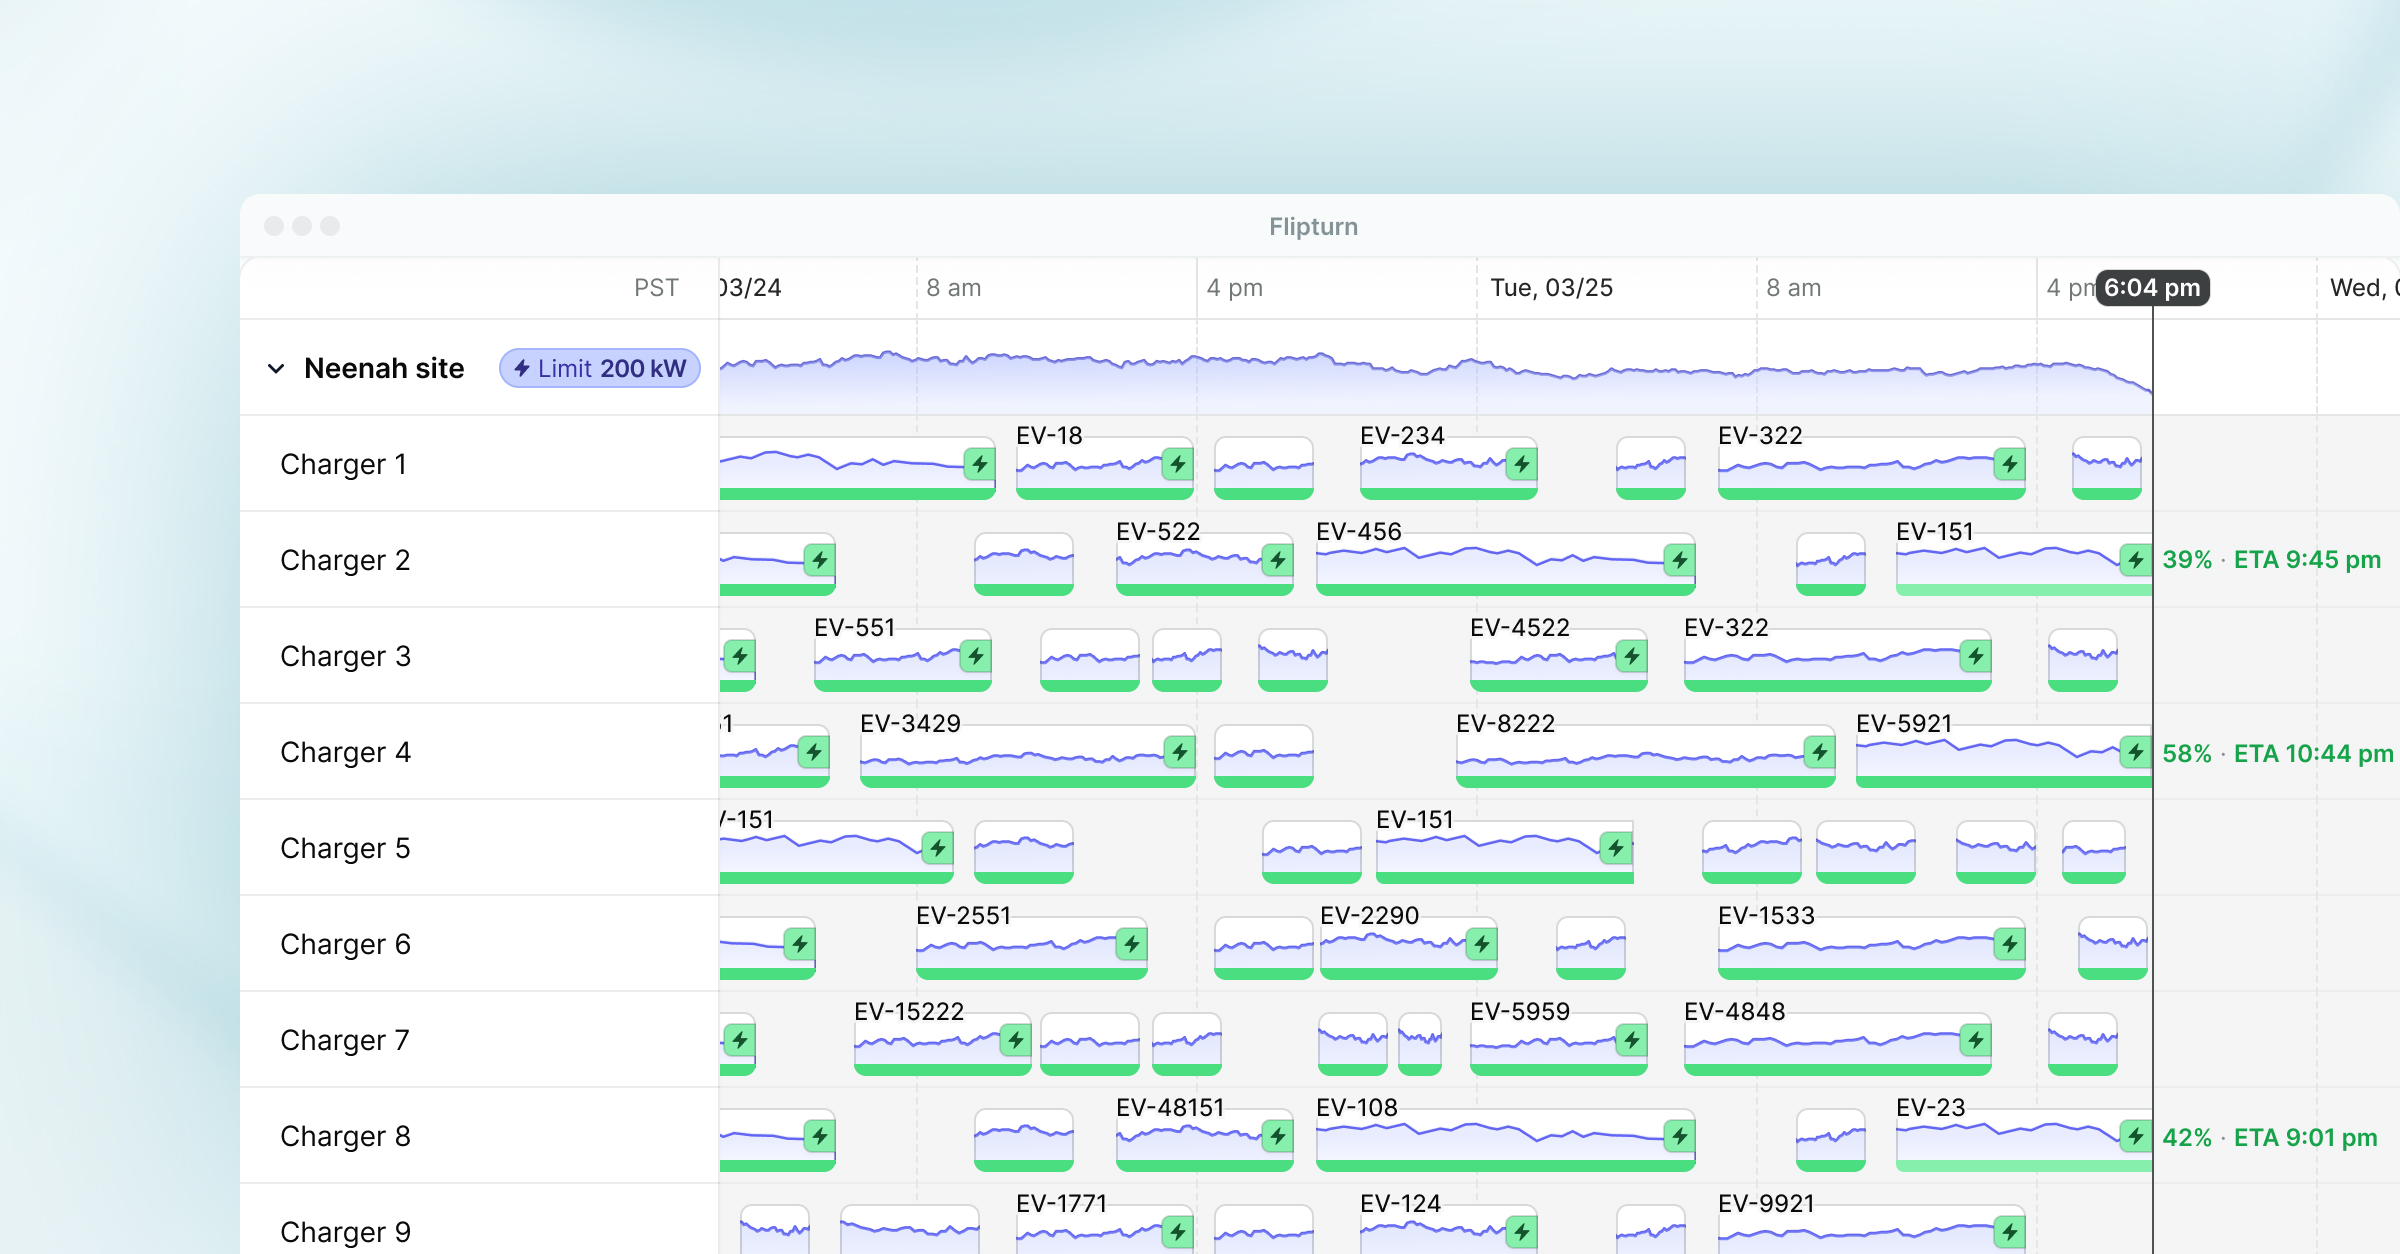
Flipturn receives real-time data from charging stations on energy delivered within each session and uses it to calculate ToU cost accurately, even when power draw varies across the session:

With this data, fleet managers can see whether charging is happening during peak windows and how much could be saved by shifting it. Flipturn's energy management automates the shift: charging is scheduled against the utility rate structure so peak hours are avoided by default.

Demand and facilities charges (power cost per kWh)
Diesel and gasoline are priced by the gallon: 100 gallons cost 100 times the price of one gallon. Electricity often isn't. Utilities typically charge separate fees based on the absolute maximum power your facility pulls from the grid at any point in time during a monthly billing period. These fees are called demand or facilities charges. If your site normally pulls 300 kW but spikes to 600 kW once during the month, the utility bills you on that 600 kW peak, multiplied by the per-kW demand rate.
Flipturn uses real-time charging-session data to calculate each site's power demand curve. Fleet managers can see which charging events caused power spikes, rank the worst demand peaks, and trace each one to a root cause. Energy management applies peak shaving to prevent future spikes by distributing power across active chargers in real time, keeping total site draw below the demand threshold. Customers using this approach have cut their demand-charge costs substantially: Titan Freight reported dropping their effective electricity cost from $0.40/kWh to about $0.18/kWh after deploying Flipturn (see their story), and Purolator reported a 60% reduction in peak demand charging costs (see their story).
For the math on why peak power often costs more than energy itself, see our worked example on lowering peak power demand.

Diesel and gasoline are priced by the gallon: 100 gallons cost 100 times the price of one gallon. Electricity often isn't. Utilities typically charge separate fees based on the absolute maximum power your facility pulls from the grid at any point in time during a monthly billing period. These fees are called demand or facilities charges. If your site normally pulls 300 kW but spikes to 600 kW once during the month, the utility bills you on that 600 kW peak, multiplied by the per-kW demand rate.
Flipturn uses real-time charging-session data to calculate each site's power demand curve. Fleet managers can see which charging events caused power spikes, rank the worst demand peaks, and trace each one to a root cause. Energy management applies peak shaving to prevent future spikes by distributing power across active chargers in real time, keeping total site draw below the demand threshold. Customers using this approach have cut their demand-charge costs substantially: Titan Freight reported dropping their effective electricity cost from $0.40/kWh to about $0.18/kWh after deploying Flipturn (see their story), and Purolator reported a 60% reduction in peak demand charging costs (see their story).
For the math on why peak power often costs more than energy itself, see our worked example on lowering peak power demand.
How Flipturn can help
Cost per mile only works as a decision-making metric if you can see every input — vehicle efficiency, energy cost, and power cost — across every vehicle and site. Flipturn is hardware-agnostic, OCPP-compliant software built for fleets electrifying at scale that pulls those numbers into one place and lets you act on them.
Book a demo, or browse how fleets use Flipturn in production.